Labs materials
Схема розділу
-
-
Учні повинніПозначити як виконано
Lab 1
-
-
Учні повинніПозначити як виконано
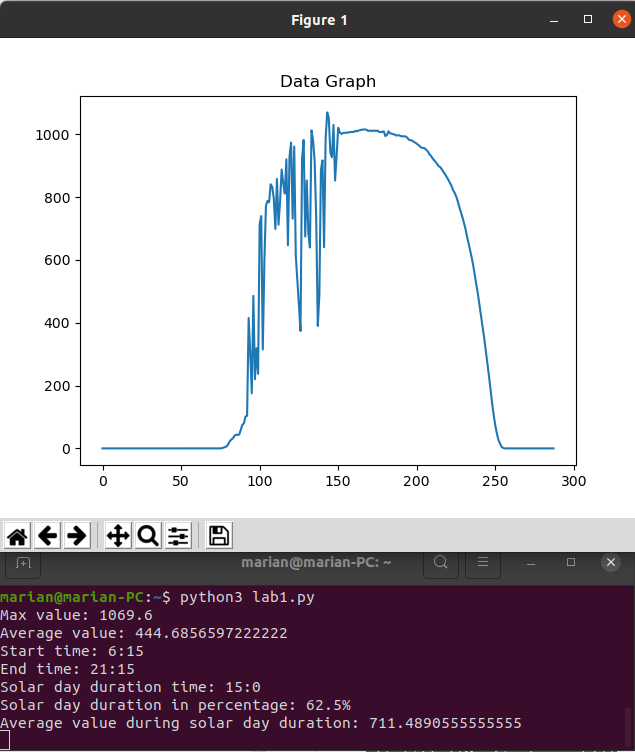
Using basic Python functions for data analysis
-
-
Учні повинніПозначити як виконаноResult example

-
-
Учні повинніПозначити як виконано
Lab 2
-
Учні повинніПозначити як виконаноUsing Histograms and PMFs to visualize data distribution
-
-
-
Учні повинніПозначити як виконано
Lab 3
-
Учні повинніПозначити як виконаноUsing Percentiles and Cumulative distribution functions to visualize data distribution
-
-
-
Учні повинніПозначити як виконано
Lab 4
-
-
-
-
Учні повинніПозначити як виконано
Lab 5
-
Учні повинніПозначити як виконаноProbability density function and other parameters
-
-
-
Учні повинніПозначити як виконано
Lab 6
-
Учні повинніПозначити як виконаноFinding the relationships between variables
-
-
-
Учні повинніПозначити як виконано
Lab 7
-
Учні повинніПозначити як виконаноTesting the normal distribution hypothesis
-
-
-
Учні повинніПозначити як виконано
Lab 8
-
Учні повинніПозначити як виконаноTesting the hypothesis using Pearson criteria
-
-
-